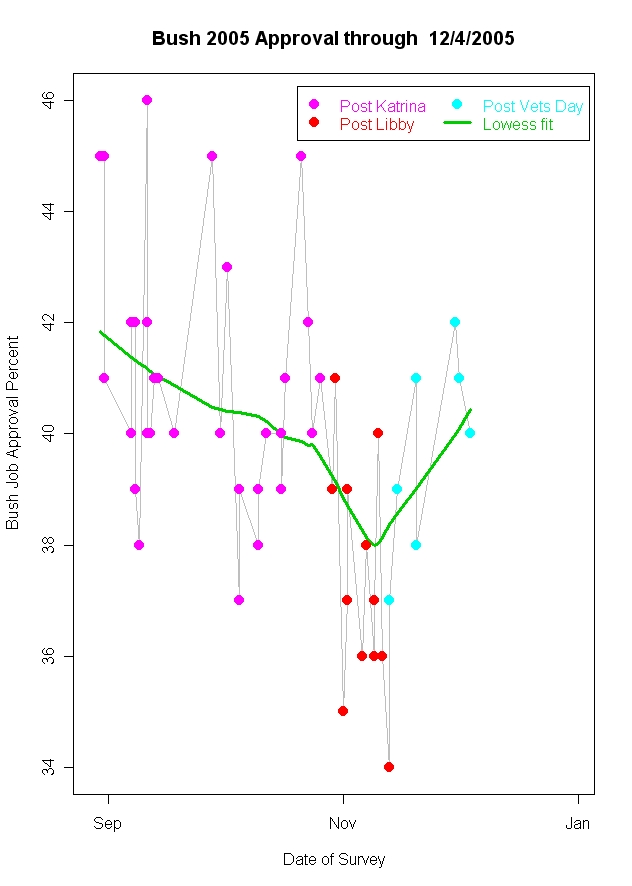
Approval of President Bush may have taken an upturn in the wake of his Veteran's Day defense of the Iraq war and renewed White House emphasis on responding to critics of the war. However, the upturn is not yet statistically significant, leaving some doubt based on the seven polls currently available since Veterans Day.
In the above graph, the general decline in presidential approval since Hurricane Katrina is evident, with evidence that there was increased decline following the week of the Lewis "Scooter" Libby indictment, the Harriet Miers withdrawal and the 2000th U.S. military death in Iraq.
On November 11th, President Bush launched a new series of speeches, aided by Vice-President Cheney and other White House spokespeople, that vigorously defended the Iraq war, the President's use of intelligence and strongly criticized the arguments for a quick withdrawal of troops from Iraq. Coupled with good economic news, one might predict an improvement in the President's approval as he gives his supporters a renewed argument in favor of his handling of the presidency.
The upturn in the polls is evident from the graph. What is still in question if whether the data are strong enough to give us confidence the increase is real, and not a random fluctuation in the polls. If we estimate a model of approval for the year that includes effects of Katrina, Libby and Veterans day, as well as the long-term downward trend seen all year, then the post-Veterans Day effect is a robust +2.85% improvement, and is statistically significant. However, these polls are themselves subject to persistent "house effects", the tendency of polling organizations to produce results that are consistently above or below the average of other polls. When we take these "house effects" into account in the model, the post-Veterans Day effect is a still positive +1.26%, but it is no longer statistically significant.
A way to get a "feel" for this is to note in the graph that three of the seven post-Veterans Day polls are well within the range of variation of the previous trend. The other four polls all are either above that range or right at the top of the range. So the evidence is certainly suggestive, but not yet convincing beyond a reasonable doubt.
Another way to see this is to plot the data as boxplots, so we can see the median and the spread of the data at various times of the year. In the boxplots below, the horizontal black line inside the rectangle is the median, and the rectangle covers the 25th-75th percentiles of approval. The lines that extend out from the rectangle show the range of the data outside the 25th and 75th percentiles. There is one unusually high approval rating in the Post-Katrina box, which is plotted as a point. (The area of the boxes is proportional to the number of polls in each period.)
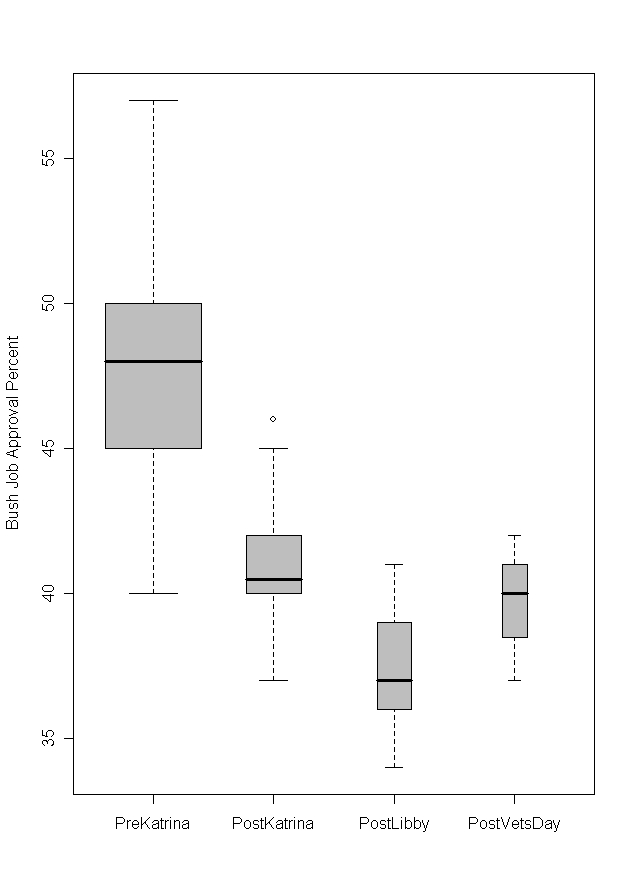
While the Post-Katrina data are well below the box for Pre-Katrina, and Post-Libby is well below that for Post-Katrina, the current resurgence in Post-Veterans Day still significantly overlaps with the Post-Libby data. If the improvement in approval is real, we should see this box separate from the Post-Libby box. More polling, and a continued upward trend, could demonstrate that. The Thanksgiving holiday depressed the rate of polling, unfortunately, just when some new polls would be welcome. Hopefully the next few days will provide more data and more confidence in the trends.
Data: The data include all national polls through December 4. This includes a Time poll taken over the weekend, and a Quinnipiac poll ending December 4. See The PollingReport.Com for the data.
Note the comparison with my plots of Bush Approval over the year and over the term here and here. The year-long plot shows a small upturn at the end. The full-administration plot does not. That reflects the relative influce of these seven polls at the end of the data. The lack of statistical significance keeps the upturn looking small or non-existant in the more comprehensive graphs. As more data arrive, the late-trends will become more apparent there as well as here where I have "zoomed" in on recent developments, giving more influence to the last 7 polls in a smaller pool.