Updated to include all four polls taken 1/8/06. Updated comments follow the original post.
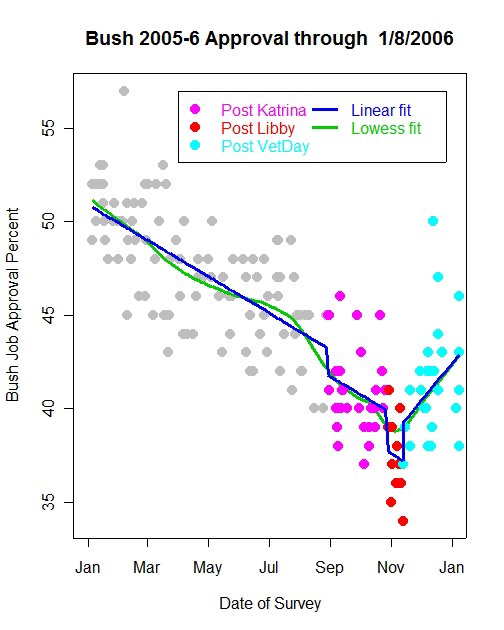
Approval of President Bush took a sharp upturn after November 11. Since that time approval has gained some 6%, from 37% to 43%. With no polls taken over the Christmas and New Year's hollidays, it has been hard to assess how strong this rebound has been since mid-December. The appearance of three new 2006 polls has given us a little better handle on this, though it will still take another half-dozen polls to have a good sense of the path approval is taking in the new year.
In the graph above, the November-December surge is clear. The blue line represents my regression model of approval, while the green line is a local regression (lowess) fit. The two track quite well, so for now I am using the linear model for analysis. However, if the local fit uses less data to fit the trend, it shows a leveling out of approval since mid-December. That estimate is very fragile, however, because it rests on few data points and those are at the end of the trend, a point that is always hard to estimate.
To ask if the upward gain has been slowing or remained steady since December 1, I took a different approach. I fit the linear model for polls available as of each day since December 1. Each day that a new poll appears is added to the data at that point. This allows me to estimate the "gain rate" for the President, and see how it depends on which polls are included in the data at that point. If this gain rate remains stable throughout the 40 days since December 1, then this is evidence that the President's rebound is solid and continuing. If the gain rate slows, then this suggests that approval is stabilizing in the latter part of this period, and no longer increasing as fast as in November and early December.
The "gain rate" is the expected gain in approval percentage PER DAY. A rate of .10 means a .1% increase per day, or 1% over 10 days.
One possible complication is the Hotline poll from mid-December which produced an exceptionally high approval rating of 50%. I've discussed this poll at length here. When that poll enters the data, it causes an sharp increase in the estimated gain rate, as does the ABC/Washington Post poll a few days later. However, as more polls have come in, this influence becomes much less, so that by the polling of 1/8/06, the estimated gain rate is virtually identical with or without the Hotline poll. For that reason I've included the Hotline in the graph below.
Flat parts of the graph are days on which no new polls appeared so the estimated gain rate is constant in the absence of new polls.
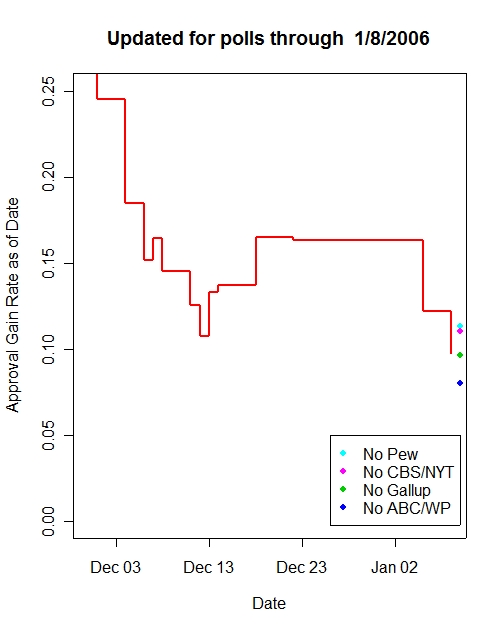
This graph makes clear that the estimated gain rate has in fact slowed throughout the month of December and early January polls. It remains postiive, showing that approval of President Bush remains on the upturn, but that rate of increase has now fallen from .25% per day (a 1% gain every 4 days) to just under .10% per day (a 1% gain every 10 days.) That decline is important and raises the question of whether the initial impact of the White House's new assertiveness in November has now been spent, or if new issues, such as the NSA warrentless call monitoring has had an effect. Before chalking this up to politics, it is also possible that the holidays simply reduced the public's attention as well as dampening the "input" of the political signals as well.
In any case, there is good evidence here that the gain rate has slowed. New data in January will be needed to clarify what the trajectory will be in early 2006.
Updated 1/12/06.
Thanks to Mystery Pollster here for tipping me off to these new polls here and here. I'm out of town and hadn't had time to find them on my own. MP has an excellent discussion of these which agrees in part but offers some smart points that aren't constrained by the methodology I use here. Do check out his points.
Four polls have now been released that all ended on 1/8/06. I've updated the graphs to include two of these that were not available at the time of the original post. The importance of these is that they include an ABC/WP poll that previously had found an unusually high rating of the President. That rating fell in the ABC/WP January poll, but by only 1 point, from 47% to 46% approval. This relatively high rating might be expected to raise the gain rate estimate above my previous one of about .10% per day.
At the same time, the Pew Center for People and the Press poll was taken, yet it produced and estimate of only 38% approval, exactly the same as in their last poll. Such a low estimate might also be expected to change my estimates of the gain rate, but in this case to make it even lower.
New Gallup and CBS/NYT polls also appeared, with CBS finding a 1 point gain from 40% to 41% since December, while Gallup found not change at all, at 43%.
Updating my estimates of the gain rate resulted in no significant change from my original estimate. The estimated value is .0987% per day, or about .10% per day. While it matters which polls you include in this estimate, the second figure above shows that it doesn't matter much. The four colored dots show the estimated gain rate if we EXCLUDE each of the new polls in turn. The result is some variation in the precise estimated value, but all remain pretty close of .10% per month. These four estimates all fall WELL within the 90% confidence region of the overall estimate as well.
So I conclude that the gain rate estimate is not especially sensitive to the mix of latest polls. All lead to the same qualitative conclusion: The gain rate is .10, or a gain of 1% in approval each 10 days.
What is STILL not answerable from these data is whether the declining gain rate we have found in this analysis has continued to decline, making approval currently flat, or whether it is reduced but still a non-trivial percentage point every week and a half. For that there is no substitute for more data. If you push these data as hard as you possibly can (and beyond the point of wisdom, caution or sanity-- I'm talking about with my methods, not criticizing MysteryPollster!) then the last handfull of polls do indeed look like approval has now stabilized at 43% and hasn't been gaining at all in recent days. But that would be a fool hardy prediction based on the limited data, so I would not make that conclusion yet. I think the rather strong evidence we DO have here is that the approval gain that was a quite high .25% per day when the White House launched it's public opinion offensive on November 11 has declined to a still positive but much smaller .10% per day. I am satisfied with that strong analysis and am willing to wait for equally strong analysis about what has been happening after New Years.