Since March 17 there have been only three new national polls with presidential approval results released. This lull in polling couldn't have come at a worse time for those of us wondering if President Bush's recent emphasis on defending the Iraq war would put a brake on his declining approval ratings which have fallen some 6 points since late January. I posted on whether approval was still declining here, and wrote about the problem of recognizing poll-to-poll change here. In the nearly 3 weeks since, we've seen only 3 new polls. This will make answering the question of "what effect did the President's speeches and news conference have" much more difficult. By now, any such effect has also become confounded with the immigration debate and the Mexico trip. Still, we have to look at what the data say so far, and anticipate a flurry of new polls with the start of a new month.
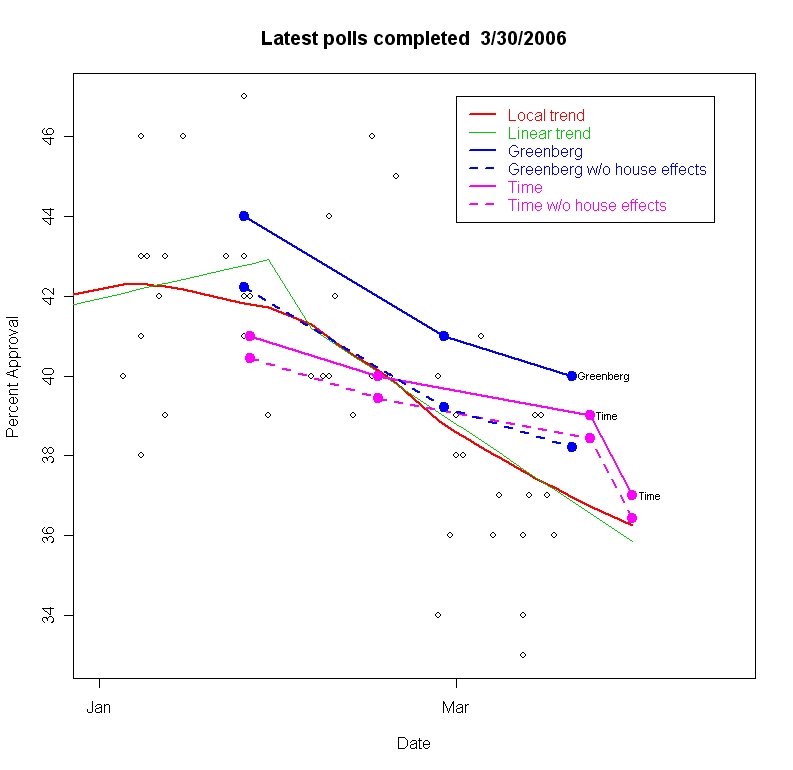
Since March 17, Greenberg (Democracy Corps) has released one survey and Time has released two. These three data points are labeled in the figure above. I've also "connected the dots" to give a clear "apples-to-apples" comparison of trends in these two organizations' polls in 2006. Both are down slightly since late February. Greenberg has moved from 44% on January 25 to 41% on February 27 to 40% on March 20. The Time poll has moved from 41% on Jan. 26 to 40% on Feb. 16 to 39% on March 23 to 37% on March 30. None of the changes from one poll to the next is statistically significant though the change since January is close (4.4% change is the 95% confidence interval for two independent polls of 1000 cases each, which is the approximate size of all these polls.) See my post on poll-to-poll change if you think this lack of statistical significance is surprising.
In my model of approval, these new polls do not come close to producing a statistically significant change in the trend estimated since February 1. However, they are all three a little higher than the model predicts. If we plot the residuals of that model in the figure below, the deviation from zero is clear. The local fit line in the figure is bending up slightly, suggesting that the rate of change since January has been slowing slightly with time, rather than a constant decline as the model claims. This bend, however, is very slight and we still lack enough data points to reach a confident conclusion.

Taking out the house effects brings all three polls a bit closer to the predicted level of approval, but they remain a percentage point or two above the predicted trend.
And so the data refuse to give a clear answer. The downward trend in these two polls appears to have continued in March. The lack of statistical significance of those changes is to be expected given the spacing of the polls and the rate of change in approval estimated by my model. The three positive residuals also fail to indicate a significant change in approval, but they are consistent with a slowing of President Bush's decline.
And so in the end I say these results are not inconsistent with my earlier claim that approval was continuing to decline. Sadly, we'll never know what the short-term effect of the White House's new effort to rally support may have been, thanks to the surprising lack of polls these three weeks. But as new polls arrive (and surely they will) we will finally be able to get reliable new estimates of the approval trend since mid-March.
UPDATE 4/11: Lots of new polls have finally arrived. See the Table of Contents here for the latest.