
The CBS/New York Times exit poll data for the CT primary are now available (thanks to Mystery Pollster for the link. The CBS/NYT release is here. Be sure to also see Mystery Pollster's discussion of this and related issues here.)
I warned in the previous posts that aggregate "ecological" data have their pitfalls. Here we get a chance to compare some results from there with results from the individual level relationships available in the exit poll.
The aggregate data showed a substantial relationship between social status and vote. The figure above shows that if we use education as a measure fo socio-economic status we find a substantial individual level relationship. As education rises, Lamont vote does as well, from 39% among those with high school or less to 55% among college grads.
When we switch to individual level income, the effect is surprisingly small. Those making under $50k supported Lamont at a 48% rate, while those over $100k voted for him 52% of the time. That's not much difference, especially given the aggregate data I looked at earlier that found about a 12 point gap between the wealthiest and poorest towns. My interpretation is that context matters quite a bit, while individuals vary a lot across contexts. Well off people live in both high and low income areas, but they voted more for Lamont if they lived with lots of others with high incomes. The exit poll doesn't consider the context, so the income effect is quite modest at the individual level.

There are other ways to interpret differences between aggregate and individual level patterns of income effects. A recent terrific paper by Andew Gelman, Boris Shor, Joseph Bafumi and David Park is here, with some blog discussion and a powerpoint version here. This is not for the weak, but does a great job explaining income effects on Dem vs Rep voting. It incidentally finds that individual level income effects are weakest in Connecticut. That wouldn't necessarily carry over into a partisan primary, but it is an interesting point.
My conclusion is that the individual data continue to support the conclusion that Lamont did best with higher socio-economic status individuals.
A second point of individual vs aggregate difference concerns race. In the CBS/NYT exit polls, African-Americans actually voted for Lamont at higher rates than did whites (see the figure below). In contrast, the aggregate analysis found that as the percent black increased from zero to about 3 percent, the Lieberman vote increased substantially, from about 38% to 50%. But this is a clear illustration that the aggregate effect CANNOT be accounted for by purely individual differences. At no more than 3% of the population in these towns, blacks could not possibly account for a 12 point shift in the vote. Rather what we saw with the aggregate pattern was that there were sharp differences in vote between towns that were the most homogeneously white and those with a bit of diversity (while remaining very largely white.) Context matters a lot for behavior in this case, and the small percentage of blacks is an indicator of that context, not of individual differences in vote choice.

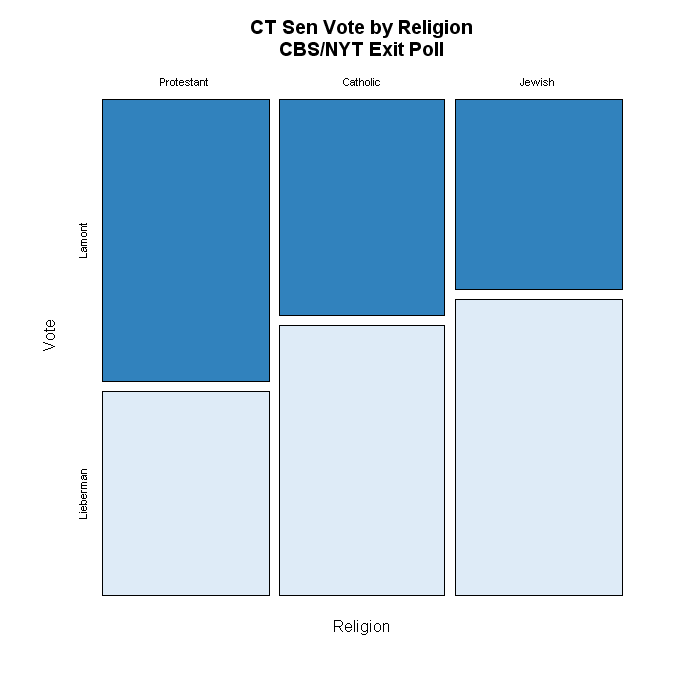
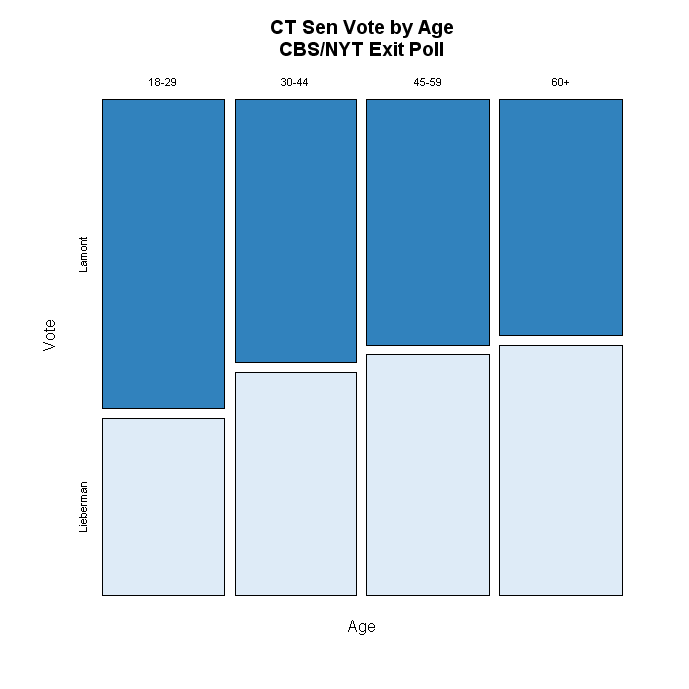
Two other variables have substantial effects on vote, but I don't have much to say about them: religion and age. Both go in the perfectly reasonable expected directions and neither seems to offer a revelation, at least to me.
The effect of ideology is likewise not at all surprising, but here the CBS/NYT exit poll does provide us with the best first hand evidence of how voters shook themselves out in the end. Unfortunately, the CBS/NYT release doesn't tell me how many voters are in each of the ideology groups, so the bars are all equal width (as above also) which is too bad. Widths proportional to population would be a better picture of how important each group was, as well as how different. Since moderates and conservatives behaved about the same, that isn't crucial for the interpretation. What mattered a lot for Lieberman is that in the end he was only able to hold on to the votes of only 59% of the moderates, losing 39% (the rest are missing in the exit poll tables.) But perhaps surprisingly, Lamont won only a slightly greater 62% of the liberals' votes. Liberals and conservatives split on the vote, but both groups have substantial minorities that went the other way.

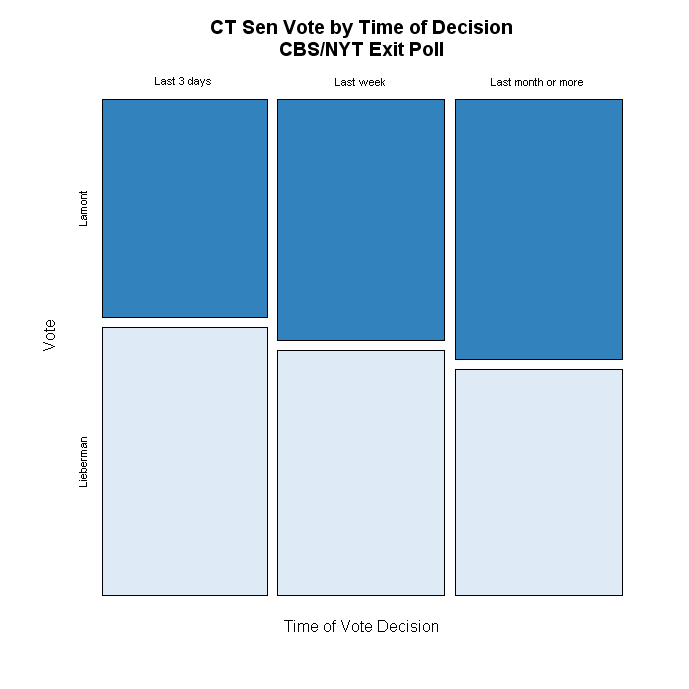
Finally, the time of the vote decision is an indicator of campaign dynamics. We saw polls range from +13 to +10 to +6 for Lamont, suggesting a return to Lieberman was under way. The data here suggest that at least those who waited until the end to make up their mind did in fact give more support to Lieberman. Lamont got 44% of the last minute deciders, to Lieberman's 54%, while Lamont won 53-46 among those who decided a month or more before the election. (The flaw with this is that it may have more to do with the characteristics of late deciders, for example their interest and involvement in politics, than with the dynamics of the campaign per se.)
This has been fun, but I hope this is the last I have to say on the CT Primary for a while!
Click here to go to Table of Contents